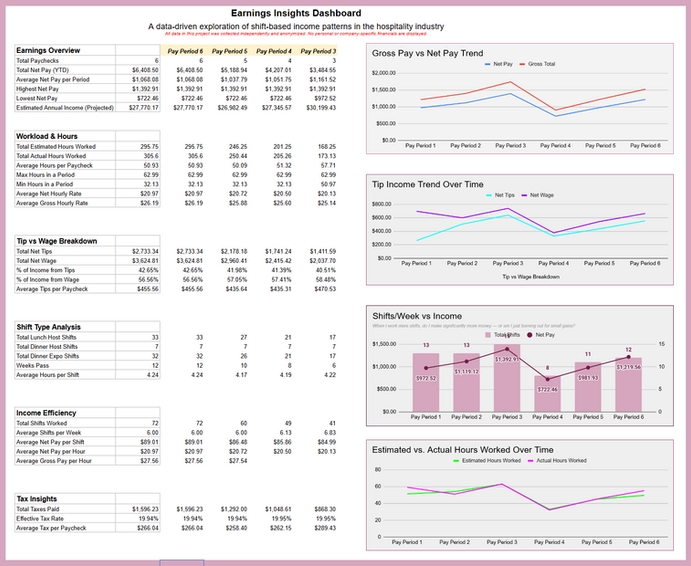
Earnings Insights Dashboard
UX + Data Visualization Project
Role: UX Strategist & Data Visualization Designer
Duration: 3 months of data collection and observation
2 weeks of dashboard design and delivery.
Tools & Methods:
-
Excel for data modeling & dashboard design
-
Manual data collection and categorization
-
Custom tip-calculation formulas based on internal tip distribution structure
⚠️ All data in this project was collected independently and anonymized. No personal or company-specific financials are displayed.
Quick Summary
Objective: Analyze company revenue, compare role-based earnings, and identify busiest days and times of day
Data Period: 3 months of manual data collection across 6 pay periods
Roles Analyzed: Host, Expo, Bar
Key Metrics: Daily revenue, role-specific earnings, tip allocation, day/time performance
Tools Used: Excel (dashboard design), custom tip-calculation formulas
Major Findings: Dinner shifts earn ~21% more than lunch; Expo roles during dinner are top earners; Fridays and Saturdays are peak revenue days
Deliverables: Interactive Excel dashboard with filters, visual trends, and forecasting capability
Methodology
-
Data Capture
-
Collected daily earnings across all roles
-
Logged revenue totals and individual compensation per shift over multiple pay periods
-
-
Tip Formula Calibration
-
Developed tip-estimation formulas reflecting the company’s tip pooling and allocation mechanisms
-
Ensured consistency and comparability across roles and shifts
-
-
Time-Based Aggregation
-
Mapped earnings by
-
Day of week (e.g. Monday, Tuesday...)
-
Time of day (e.g. lunch, dinner, late-night)
-
-
-
Data Structuring & Visualization
-
Built a dashboard with filterable tables, trend charts, and comparative role metrics
-
Enabled interactive exploration across dimensions: role, day, time
-
Results
-
Data Scope
-
6 pay periods captured
-
75+ shifts logged across 3 roles (Host, Expo, Bar)
-
-
Earnings Comparisons
-
~21% higher average earnings per shift during dinner compared to lunch
-
Dinner expo roles delivered the highest hourly income
-
-
Scheduling Insights
-
Detected inefficiencies—e.g. overlapping roles or under-staffed shifts
-
Identified peak revenue days (e.g. Fridays and Saturdays) and busiest hours (typically dinner service)
-
-
Forecasting Capability
-
Dashboard’s tip-estimation formulas enabled predictive income planning per role and shift type
-
Findings
-
Dinner Shifts Drive Earnings
-
Consistent ~21% uplift in average earnings during dinner vs lunch
-
Highest compensation yielded by expo roles during dinner
-
-
Days with Highest Demand
-
Weekends (especially Fridays and Saturdays) generate the most revenue
-
Weekday variability suggests opportunity for dynamic scheduling
-
-
Underutilization & Overlaps
-
Some shifts show role-overlaps or idle capacity—costly under current tip structure
-
Potential to rebalance scheduling for more efficient distribution
-
-
Predictive Insight Value
-
Tip-based formulas allow forecasters to anticipate income by role/day/time
-
Supports data-driven staffing and shift planning
-
Dashboard Deliverables
-
Fully functional Excel dashboard including:
-
Filterable shift-level data (role, day, time, earnings)
-
Visual charts: earnings distribution, trendlines by role/time
-
Interactive features for exploring patterns and forecasting
-
-
Documentation of tip-calculation logic for repeatability and transparency


